Create clear LaTeX tables
Present research data with readable columns, units, rules, captions, and labels.
On this page
Use a table when readers need exact values or comparisons. A good research table states what was measured, puts units in the heading, aligns comparable values, and remains readable without vertical rules or tiny type.
Build a small results table#
The tabular column specification controls alignment: l is left aligned, c
is centered, and r is right aligned. An & separates cells and \\ ends a
row. Every row needs the same number of cells.
\documentclass{article}
\usepackage{booktabs}
\begin{document}
\begin{center}
\begin{tabular}{lrr}
\toprule
Method & Accuracy & Time (s) \\
\midrule
Baseline & 0.82 & 14.2 \\
Proposed & 0.89 & 11.7 \\
\bottomrule
\end{tabular}
\end{center}
\end{document}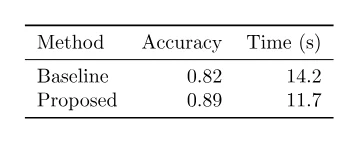
The measurements are illustrative, not experimental evidence. booktabs
supplies restrained horizontal rules. Put a unit such as seconds in
the heading instead of repeating it in every cell. Use the same precision within
a column unless precision itself carries meaning.
Add a caption and reference#
tabular draws the grid; table lets LaTeX place, number, and caption it. Put
the label after the caption so it receives the table number.
Table~\ref{tab:runtime} compares the two methods.
\begin{table}[htbp]
  \centering
  \caption{Validation accuracy and mean inference time.}
  \label{tab:runtime}
  \begin{tabular}{lrr}
    \toprule
    Method & Accuracy & Time (s) \\
    \midrule
    Baseline & 0.82 & 14.2 \\
    Proposed & 0.89 & 11.7 \\
    \bottomrule
  \end{tabular}
\end{table}
The surrounding prose should state the conclusion rather than recite every cell. The caption should identify the population, condition, or statistic needed to understand the values.
Align numbers and wrap text#
For decimal alignment and units, use siunitx when the venue template allows
it. Its S columns align numbers by their decimal marker and keep formatting
consistent. For explanatory text, use a fixed-width p{...} column or
tabularx rather than forcing long prose into l.
This complete example lets the note column use the available width while the measurements align by decimal marker:
\documentclass{article}
\usepackage{booktabs,siunitx,tabularx,threeparttable}
\begin{document}
\begin{table}[htbp]
  \centering
  \begin{threeparttable}
  \caption{Validation results across two calibration methods.}
  \label{tab:calibration}
  \begin{tabularx}{\linewidth}{
    >{\raggedright\arraybackslash}X
    S[table-format=1.2(2)]
    S[table-format=2.1]
  }
    \toprule
    Method and evaluation condition & {Accuracy} & {Time (s)} \\
    \midrule
    Baseline with default threshold & 0.82(3) & 14.2 \\
    Proposed method after calibration & 0.89(2) & 11.7 \\
    \bottomrule
  \end{tabularx}
  \begin{tablenotes}\small
    \item Values in parentheses are bootstrap standard errors.
  \end{tablenotes}
  \end{threeparttable}
\end{table}
\end{document}
Compile and confirm that both numeric columns align, the prose wraps without
crossing the margin, and Table 1 can be referenced with
Table~\ref{tab:calibration}. Braces around the numeric headings keep siunitx
from parsing those words as numbers. The 1.2(2) format reserves two decimal
places and a parenthesized uncertainty; adapt it to the precision you report.
Here 0.82(3) denotes 0.82 with uncertainty 0.03, not 0.3. State what the
uncertainty measures, as the sample note does. threeparttable keeps that note
with the table instead of hiding it in body prose.
For an optional multi-page layout, use longtable when the table needs
several pages. It replaces the
outer table float and repeats headings explicitly:
\usepackage{booktabs,longtable}
% in the document body
\begin{longtable}{lr}
\caption{Measurements by specimen.}\label{tab:specimens} \\
\toprule
Specimen & Response (mV) \\
\midrule
\endfirsthead
\toprule
Specimen & Response (mV) \\
\midrule
\endhead
S01 & 12.4 \\
S02 & 11.9 \\
% continue with the remaining rows
\bottomrule
\end{longtable}
Follow the journal template if it already defines a table style. Avoid merging cells until the header hierarchy truly requires it; simple rows and columns, real header cells, and a logical reading order are easier to interpret and tag for accessible output. A visually neat table is not by itself proof of an accessible reading order.
Repair a table that does not fit#
Do not start by shrinking the whole table with \resizebox or a tiny font.
First try these changes:
- Remove redundant words and move detail into the caption or a note.
- Put units in headings and shorten repeated labels.
- Use wrapping columns for prose and decimal-aligned columns for numbers.
- Split unrelated measurements into separate tables.
- Use a landscape or two-column-wide table only when the venue accepts it.
Compile and inspect the PDF at normal reading size. Success means no content crosses the margin, headings identify every value, and the surrounding text can refer to the table by number. Continue with floats and captions or diagnose a wide result with the overfull box guide.